Today I want to talk a bit about graphs in practice, how developing a mystery game led us to develop a whole new infrastructure useful for a much wider range of coding tasks, and why we didn’t take an off the shelf solution for working with graphs in our current endeavors at DEVLIKE.
A while back, I was working on a detective game called Poirogue that used graphs for procedural generation.

We’d start from a simple graph and then introduce different transformations that would fill in the gaps, so to speak. This method is a generalization of the standard grammar-based approach for procgen: we apply grammatical rules onto a simple seed and turn it into a complex expression, the only difference being how complex the rules are.
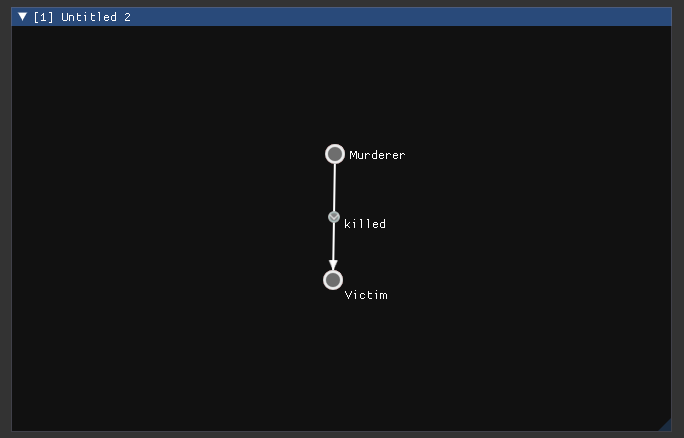
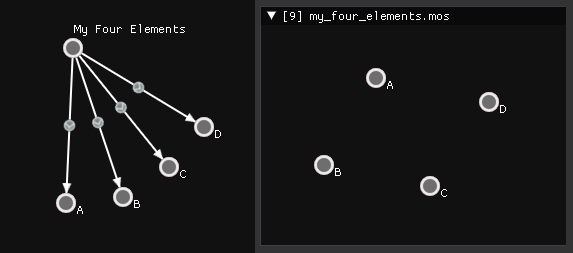
The grammatical rules are a pair of “before” and “after” graphs – here’s a simple example with a rule for “a person can know another person who is not them”:
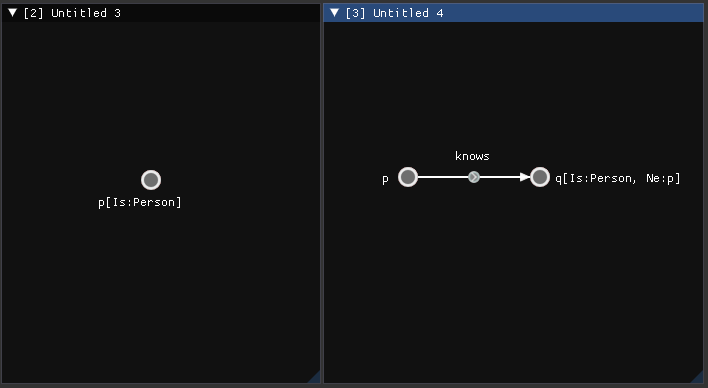
p[Is:Person] basically means that the object p has the Person component on it; q[Ne: p] means that these two objects are equal (don’t have the same ID).These are distinct graphs (in their own windows), so their connections need to be explicit in… well, another graph:
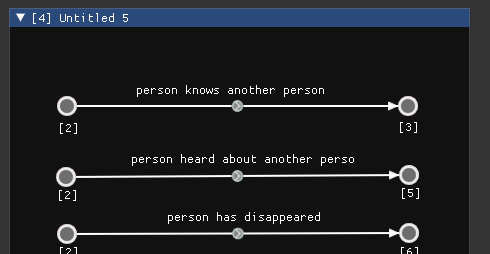
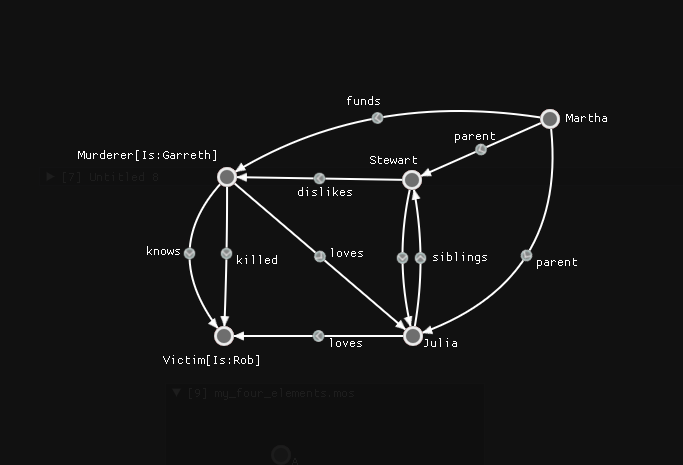
[2] and [3] are the IDs of the windows in which we defined the “before” and “after” states. There are more direct ways to show transformations, but they’re outside the scope of this blogpost. I’m sorry about all the “Untitled” windows, too…The procedural generation would then pick one arrow from this graph [4] at a time, find some subgraph of the seed that matches the “before” state, and turn it into the “after” state. Repeat this enough times while varying a multitude of factors and you can get quite a complex state of affairs:
The Hitch
Quite early on, we noticed that there was a kind of relationship we really felt we needed and were missing, and that’s this simple thing:
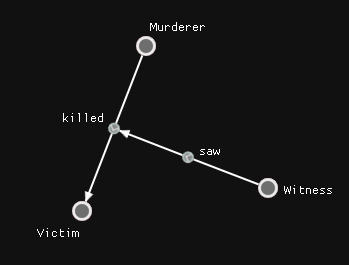
This kind of graph opened up lots of options. All of a sudden, the relationships were data that we could talk about in the case. We had heard the news, but don’t know who is spreading it — or vice versa — we know someone is talking to someone, but we don’t know what about. It felt powerful. However, this isn’t exactly in the domain of representation that we are used to.
Let’s talk about representation. Usually, what we see in libraries is something like:
let g = UnGraph::<i32, ()>::from_edges(&[
    (1, 2), (2, 3), (3, 4), (1, 4)]);
The above code is from the petgraph library and is quite common. Your graph structures have the generic types N and E for nodes and edges, often with extra constraints; and the kind of graph is somehow explained (for example, an UNdirected graph has the UnGraph struct, and a directed one is different). If we want extra data on this graph, it has to be annotated in the type too via weights, and this makes it quite important to have good higher-order functions that map between various graph types and use cases. Even with all of these, it can be very complicated. This isn’t because these libraries are bad: it’s fundamentally hard to express graphs and graph transformations via text.
Once we figured out that we need this kind of graph where edges could connect to other edges (I guess they’re called multigraphs?), our choice of library was very narrow, so we started thinking about this broadly. How do we do this in a simple to code way? The first thing that came to mind was simply keeping the data and the structure separated: have IDs for everything that would be simple and ubiquitous, use them for structure, and keep the data attached to IDs but separated into their own storage. Then we can say:
// src -id-> tgt
     1 -2-> 3
     1 -4-> 5
     2 -6-> 4
This is easier to visualize as:
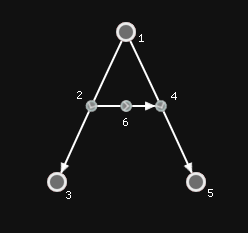
Of course, from the three lines above, we don’t know that 1, 3, and 5 are nodes, while we did know that 2, 4, and 6 are arrows. This was interesting! What this mismatch meant was that this information was somehow implicit. We ended up defining nodes as very strange arrows such that their ID, their source ID, and their target ID are all the same. The explicit complete picture now would be:
1 -1-> 1
3 -3-> 3
5 -5-> 5
1 -2-> 3
1 -4-> 5
2 -6-> 4
We never draw these node-arrows because it’s semantics: that’s what they are, and we lose nothing by hiding them. Note that we still keep the option of making self-arrows, as they have a different ID from their source and target (for example, we could have 1 -7-> 1 be a self-loop on 1).
This system could support what we wanted, but it would prove to be even more powerful! We’ve discovered… virtual particles! See, we can have some strange arrows here that can’t really easily be drawn, for example: 8 -8-> 2 and 3 -9-> 9. These are valid arrows from our representation’s point of view, but what do they mean? We took them to mean that an entity (node or arrow, or other) has a dependent entity attached to it — something that either describes them in some way or extends them into something new. We can read 8 -8-> 2 as:
The entity 8 is a description of the entity 2.
Similarly, if it’s flipped, we can read 3 -9-> 9 as:
The entity 9 is an extension of the entity 3.
By themselves, these virtual arrows don’t do much, but their value proved immense.
Enter Data
At the time, when we were still actively developing this detective game…
…our graphs had these inherent data-carrying labels, like you’ve seen above. Take for example something like p[Is: Person, Ne: q].This is a label of a node in a graph that means nothing for the graph itself: it’s an afterthought that carries no information for the graph – it might as well be called “Foobar” – it still has the same ID and we need a parser to understand what it means. It would be nice if this wasn’t a string label but rather a more complex structure that described the node itself.
Naturally, we carried that over into our new representation by assigning every entity with some data in an outside storage, confined by the boundaries of a defined type. This is very close to the idea of data-driven design which we were using anyway, so it just melded nicely! So now, not only did our arrows have an ID, a source, and a target, but they also had a component type and data. What would this look like? Let’s see our simple example from above:
1 -1-> 1 [type: Node, data: None]
3 -3-> 3 [type: Node, data: None]
5 -5-> 5 [type: Node, data: None]
1 -2-> 3 [type: Arrow, data: None]
1 -4-> 5 [type: Arrow, data: None]
2 -6-> 4 [type: Arrow, data: None]
Nodes and arrows don’t carry any data, but they are what we see, so it’s fair that they get their space too. We are restricted to one type and data block per entity, so it seems like our data is quite useless here, but this is where our virtual entities shine: we get to keep our compact form, and have as many virtual entities attached to our real entity as we like!
1 -1-> 1 [type: Node, data: None]
3 -3-> 3 [type: Node, data: None]
5 -5-> 5 [type: Node, data: None]
1 -2-> 3 [type: Arrow, data: None]
1 -4-> 5 [type: Arrow, data: None]
2 -6-> 4 [type: Arrow, data: None]
8 -8-> 2 [type: Person, data: "Jack"]
3 -9-> 9 [type: Comment, data: "This is a comment on 3"]
The entity 8 now describes a part of entity 2: it gives it an additional attribute of type Person and the associated datum. The entity 3 adds a new thing to entity 9 that isn’t by itself a part of that entity but rather an extension – connected but not fundamentally the same.
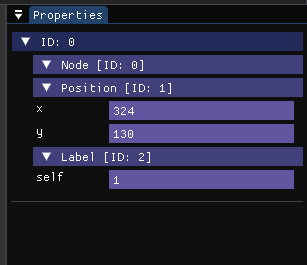
Instead of rendering descriptors and extensions as nodes themselves, we found them to be a natural part of what we call “properties” – these were the features of any object, and we’re used to seeing them in a properties-like view.
It was this quite simple thing that profoundly changed our understanding of what it means to work with graphs: we no longer have to care about the type of weights that our nodes or edges carry – they’re additional virtual entities that attach onto our essential entities and add layers to them. If we don’t need some part of it, we don’t have to transform the graph out of shape, we can just ignore it by querying.
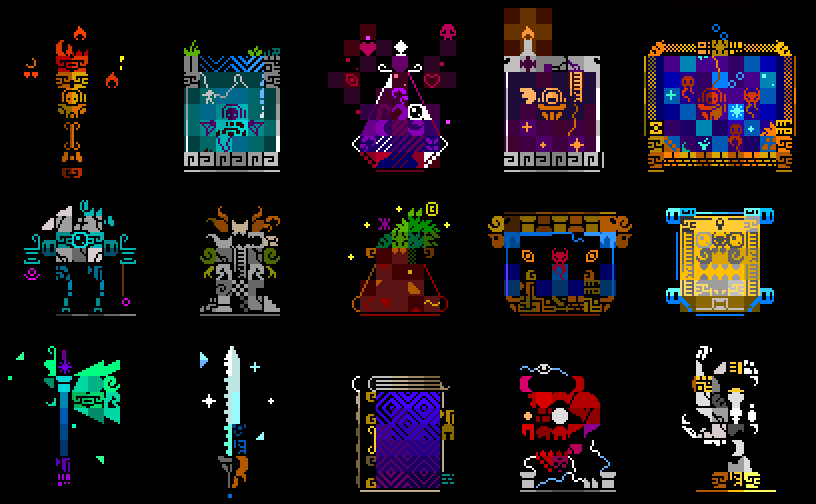
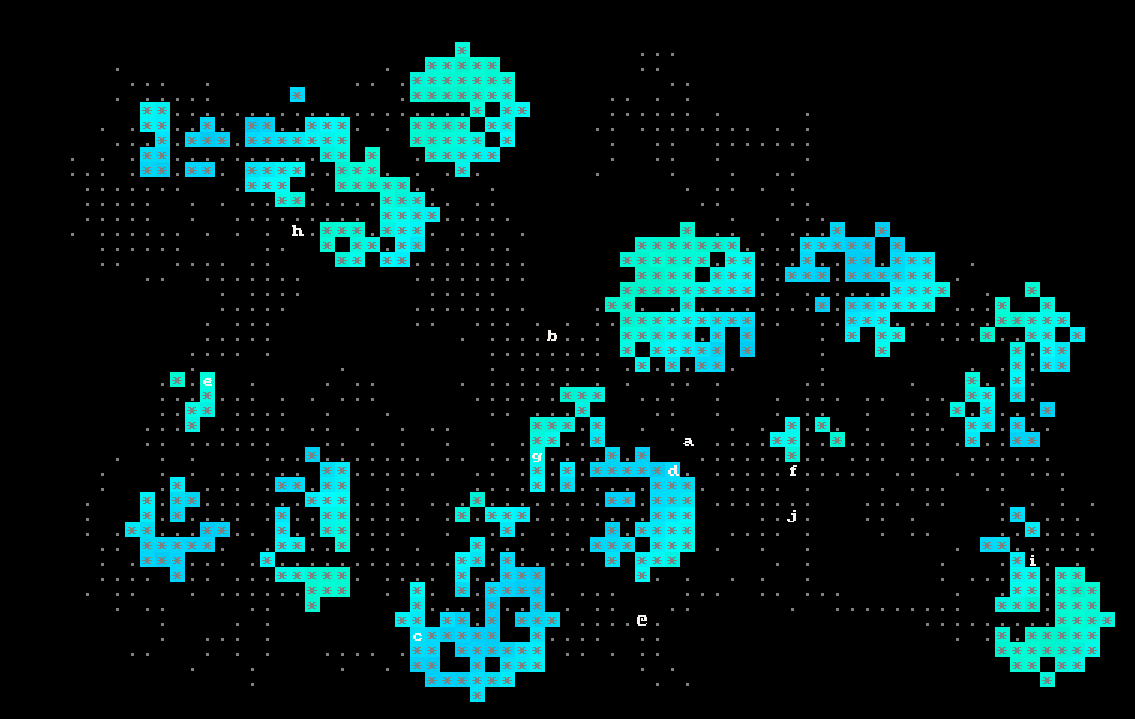
Furthermore, not all arrows are born equal. Some prefer to be arrows, other prefer to be rendered differently: these two images contain the same data, but which would you like to look at more?
What this meant for DEVLIKE was that projects went on hold while tools were being developed. We had what felt like a gold mine: a succinct format for handling relational data, storage that is highly ECS-friendly, a platform for working with graphs, and a tool that is itself using all of the above to allow for writing code where needed, and drawing graphs where it’s nicer. A bit beside the point, but the tool is written in Dear ImGui, making it simple to integrate into other tools and engines.
After a while, we started thinking about why it is that this isn’t already done. It hasn’t been a cake walk, I won’t lie, but more often than not, it felt like the hardships you face when working with graphs is the lack of a concrete ecosystem: everyone is making their own graph implementations for the exact thing they need. What we felt was needed was a single platform for graphs that allowed for all of these to have a common basis and nicer, more to the point and bespoke renderers on top. Our current goal is pushing towards that ecosystem, making it open and cool to work in, and a breath of fresh air in what is quickly becoming an industry in which the amount of time spent on transcribing a graph into code is drowning us.
In the end, hopefully, we remember to go back to figuring out who the murderer was in Poirogue. For that game, graphs are the lifeblood of the gameplay code: not only are they the core of our procedural generation, but they need to be traversed while the game is ongoing: our relations to topics and people change over time, meaning that these too are transformations of graphs, similarly described by rules that have a “before” and an “after” state.
It might seem like we’re just talking about visual scripting now, like what Blueprints do in Unreal, but it’s not the same: I don’t think we should have program flow exposed completely in a graph — even though it totally is a graph! We need to have the tools to isolate exactly the parts that work better as graphs and notice when that’s not ideal. Currently, code holds a monopoly on programming. Being able to draw a graph when its natural and when you’d do that on a whiteboard anyway – that’s when I want you to grasp (pun completely intended) for our platform and use it until you’re satisfied with what you have, and then continue coding. It’s both code and graphs all the way down, it seems.
Leave a Reply